How to use the JBS3 Risk Calculator
On the Profile screen of the JBS3 Risk Calculator, a number of inputs are first needed from the patient’s data, as follows:
- Date of birth
- Gender
- Ethnic group
- Height
- Weight
- Townsend, deprivation estimate only
- Total Cholesterol
- HDL Cholesterol
(Non-HDL Cholesterol is then calculated)
- Systolic BP
Once you have input the patient data, a number of questions are then asked in order to filter out patients who should not use the risk calculator or should use it with caution, such as ‘do you suffer diabetes?’
A number of questions are asked, such as ‘do you have a close relative under 60 with CKD’, to identify those patients that may be at higher risk of CVD
On the left side of the screen are two final questions on whether the patient already has diagnosed CVD and confirmation that the Terms & Conditions of using the Risk Calculator have been read. These questions need to be answered to proceed.
Once the Profile screen is completed, click the ‘next’ button to display the individual’s estimated CVD risk in various formats. The different screens available to show the estimated CVD risk can be changed from the top menu. The three main screens that are shown are ‘Heart Age’, ‘Healthy Years’ and ‘Outlook’.
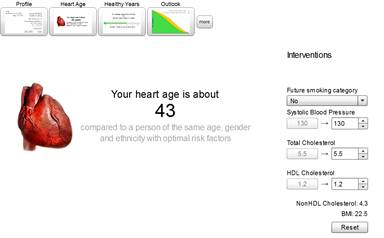
‘Heart Age’ is calculated by estimating the age of someone with the same gender and ethnicity, and the same annual risk of a CVD event, but with all other risk factors at their ‘optimal’ levels. An ‘old’ heart age provides motivation to individuals to consider what they might do to bring their heart age back to their real age, taking responsibility for their own future health.
The ‘Healthy Years’ screen shows a thermometer image giving the age the individual can expect to live to without suffering a CVD event, such as heart attack or stroke. This screen also gives a 10 year risk estimate underneath the thermometer, so the screen will be useful for GPs using the NICE guideline thresholds for drug intervention (based on 10 year risk).
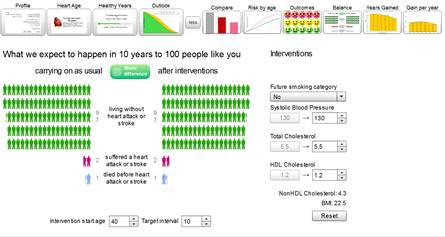
‘Outlook screen’ shows a graph image which shows the chance of survival without a CVD event. At the bottom of this screen is a box that allows the age of interventions (as selected by you on the right hand side of the screen) to be started. This screen will be useful to GPs wishing to estimate when to begin drug therapy or to illustrate the benefits of starting early lifestyle interventions to the individual.
Interventions
Once you have completed the Profile screen and clicked the ‘next’ button, all screens in the Risk Calculator have an ‘intervention’ section on the right hand side, as shown below. The fields in the ‘Interventions’ area allow the user to input various interventions, such as lowering blood pressure, to show their potential effect on the CVD risk estimate given. There is a reset button to quickly take the user back to the original (current) situation for the individual.
 |
More Displays
More screens with various ways of showing the individuals’ risk are available, and can be used by clicking the ‘more’ button on the menu bar. The additional screens then appear on the right side of the menu bar (as below). The additional screens available include a comparison against the population (Compare and Outcomes) and screens to illustrate the potential years gained and the amount of gain per year through various interventions available.
|